What it looks like
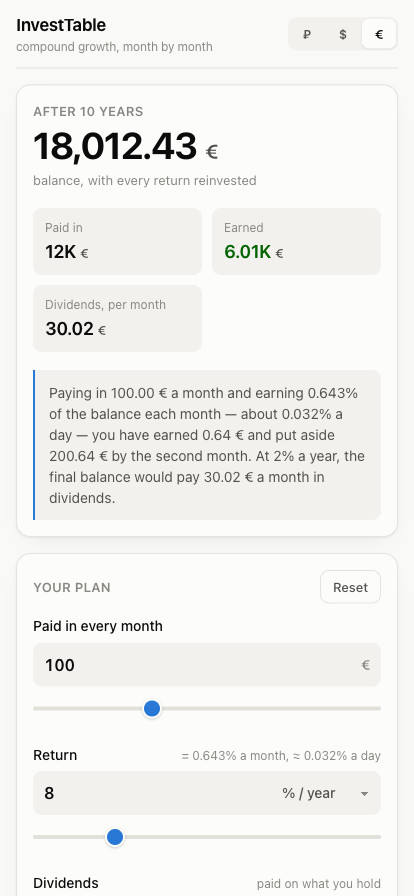
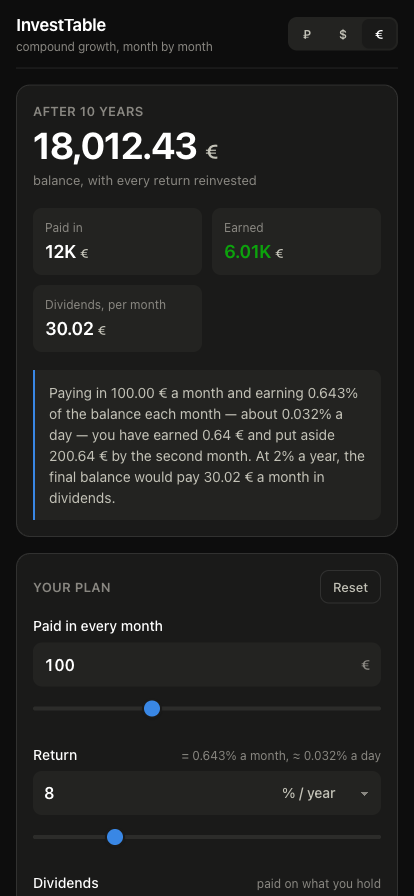
What it does
-
Every month, not just the total
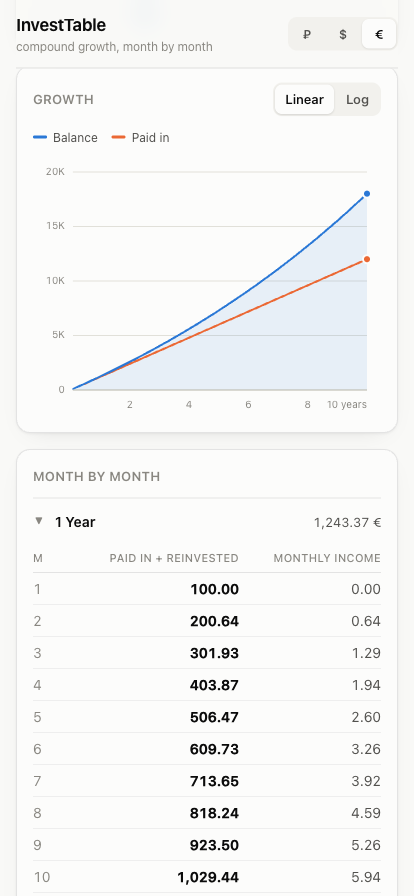
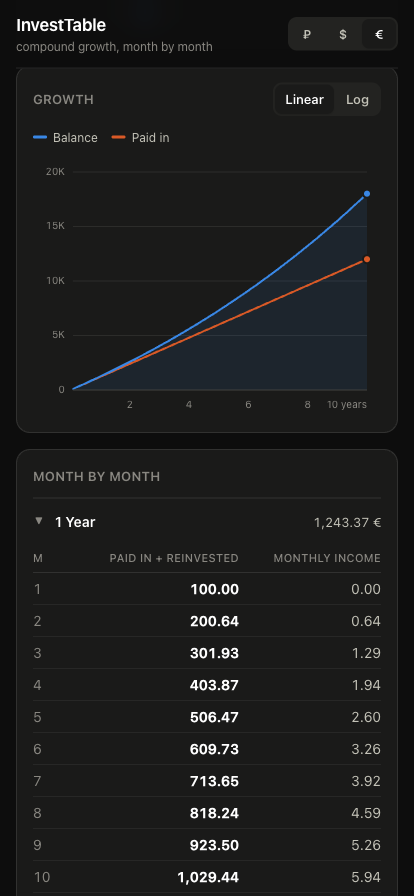
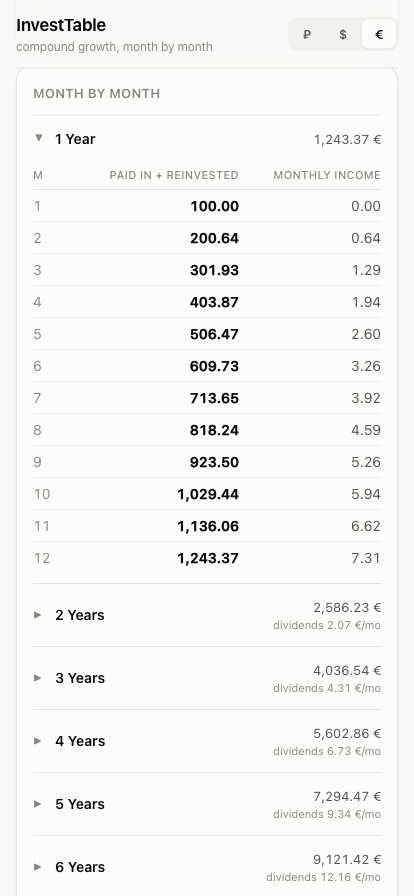
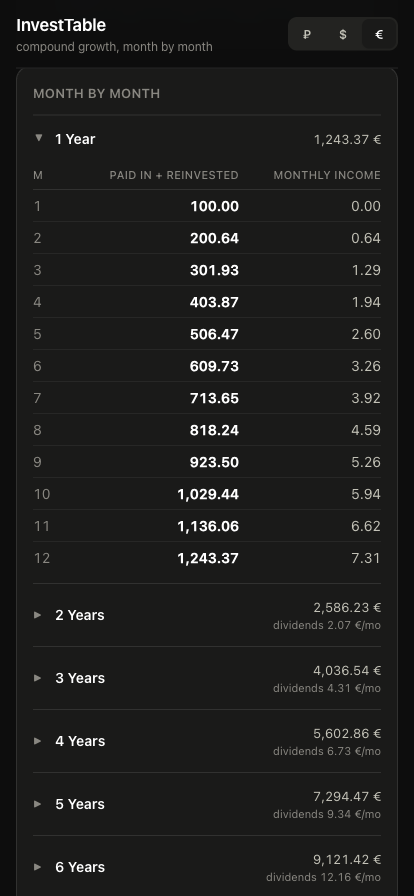
One row per month for up to thirty years: what the balance is after that month's deposit, and what it earned. Grouped into years you can collapse, so year nine is a tap away rather than a scroll.
-
A rate in whatever unit you have it
Per month, per quarter or per year — a fund's annual figure, a bond's quarterly coupon. Switching the unit only relabels the rate; the projection does not move. The conversion compounds: 20% a year is 1.531% a month, not 1.667%.
-
Dividends on what you hold
An annual dividend rate on the previous year's closing balance, spread across twelve months — the figure the position would pay you monthly without selling any of it.
-
A chart with a log scale
Balance against money paid in. Compounding spends most of the horizon looking flat and then leaves the frame; on a log scale a constant rate is a straight line, so the early years become readable.
-
Twenty languages, properly
Not just translated strings: numbers, percentages and plurals follow the language. German reads “25 Mio.”, Japanese “2500万”, Hindi groups by lakh, and Arabic mirrors the whole layout — while the chart stays left to right, as it should.
-
Your figures stay on the device
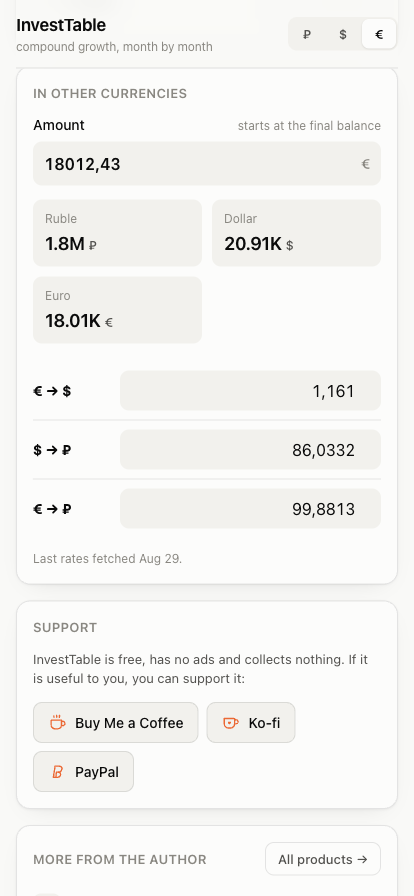
No account: your figures live in the browser's own storage. The app fetches a daily exchange-rate table, and works without it, and sends one anonymous usage count a day — no IDs, none of your figures — which a switch at the bottom of the app turns off. What it contains.
Where the numbers come from
It began as a Google Sheet called “Revenue Chart”, and the model is a port rather than a rewrite. Each month the balance earns the rate and takes another deposit; the sheet rounds every cell to cents and compounds the rounded figure, so its column drifts a cent above exact arithmetic — and so does this one, on purpose. A table that is “more correct” than the one it replaces is a table nobody can check.
That fidelity is tested rather than asserted: a script asserts 107 values, 72 of them read straight off the original spreadsheet, and it runs on every change to the model.
What it isn't
A projection, not a forecast. It assumes the return you type in arrives every month without fail and is reinvested in full, and it counts no fees, taxes, spreads or inflation. Real returns vary and can be negative. Nothing here is investment advice, and the app says so on its own front page.
It also connects to nothing: no broker, no portfolio, no prices. You type the numbers; it does the arithmetic and shows its work.